(Top frequency negative predicted sentiment words in our
COVID-19 dataset)
Explore how the U.S. general public responds to breaking news
in
COVID-19 pandemic on Twitter
Team ZeroLoss | ASA DataFest 2020 @UofT
Introduction
After the official declaration of the pandemic on March 11th, 2020,
the significant social impact of COVID-19 begins to show signs. As the vast majority
of people are encouraged to stay at home, Twitter, one of the largest social media,
is where countless interpersonal communication happens. In the United States, the
country has the highest number of confirmed cases. The government has announced many
policies, while President Donald Trump also broadcasts his opinions towards the pandemic.
In this study, we attempt to analyze how the overall sentiment of COVID-19 related
tweets changes with heated news using machine learning tools. We believe that this
project can serve as a starting point for understanding how the development of COVID-19
affected people's feelings and expressions and how distinct groups of Twitter users react
differently to COVID-19.
Data and Preprocessing
Datasets
There are two data sources that we utilized in this project. We do
analysis on the processed selection of COVID-19 Twitter dataset
(Release 12.0). To train and evaluate our model, we used SemEval-2017 Task 4A
dataset.
Figure 1. Preprocessing
Figure 2. Text Processing Pipeline
Preprocessing (Getting Actual Tweets)
The raw data from the COVID-19 Twitter dataset (Release 12.0) contains a total of
331M tweet ID entries. As shown in Figure 1, we randomly sampled 10,000 tweet IDs
for each day from March 19th to May 30th (74 consecutive days). By querying the
twitter server, we hydrated the selected tweet ids to get the text and associated
user information. (“Hydrate a tweet ID” means to get the tweet text and user
information for the tweet specified by the tweet ID). We then filtered out all
tweets from users whose location information implies they are in the states.
Text Processing Pipeline
To boost our model’s performance, we preprocessed the tweet texts in the two
datasets using a pipeline, as shown in Figure 2. To be more specific, we first
expand emojis and abbreviated forms (e.g. “we’re” into “we are”). The second step is
to remove URLs present and replace “@” with a special token “[someone]”.
These two steps aim to make sure our RoBERTa based embedding can comprehend as
much useful information as possible.
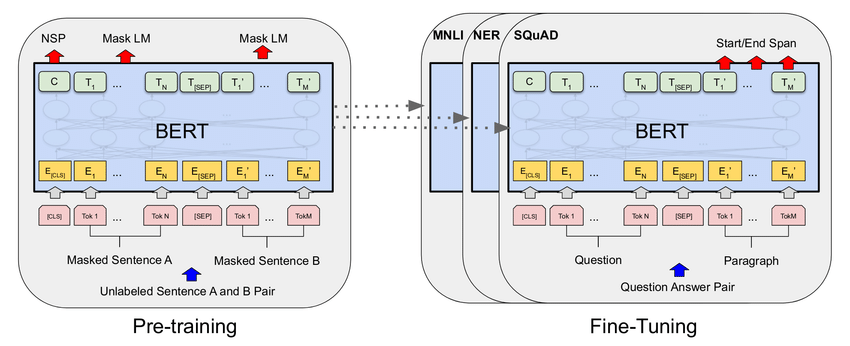
Model
Architecture of RoBERTa and BERT.
the RoBERTa Model
The RoBERTa (Robustly Optimized BERT Pretraining) model was
proposed
by Yinhan Liu et al in 2019. It builds on BERT (Bidirectional Encoder
Representations
from Transformers), which is a language representation model designed to pre-train
deep
bidirectional representations from unlabeled text. As a result, the pre-trained BERT
model can be fine-tuned with just one additional output layer to create
state-of-the-art
models for a wide range of tasks.
Fine-tuning RoBERTa
We splitted the SemEval-2017 Task 4A Dataset into train, validation and test sets.
The
statistics is the following:
Dataset
Negative
Neutral
Positive
Total
Train
4856
14368
11689
30913 (70%)
Validation
1401
4045
3386
8832 (20%)
Test
669
2072
1675
4416 (10%)
Total
6926
20485
16750
44161
In our sentiment analysis task, we utilize the transformers library by huggingface, which includes a RoBERTa model
base
in Pytorch. On top of the RoBERTa base, we trained two layers of GRU (Gated
Recurrent
Unit) to predict the probability for three sentiment classes: 0 for “Negative”, 1
for
“Neutral”
and 2 for“Positive”, with the cross-entropy loss function minimized on Stochastic
Gradient Descent Optimizer. We train the model on the train set and select the model
with the lowest validation loss (the value of the loss function on the validation
set).
Performance
Our final model has the following performance, evaluated using the validation set
and
the test set:
Metric
Value
Accuracy (validation)
70.2%
Macro F1 score (validation)
69.1%
Accuracy (test)
69.7%
Macro F1 score (test)
68.7%
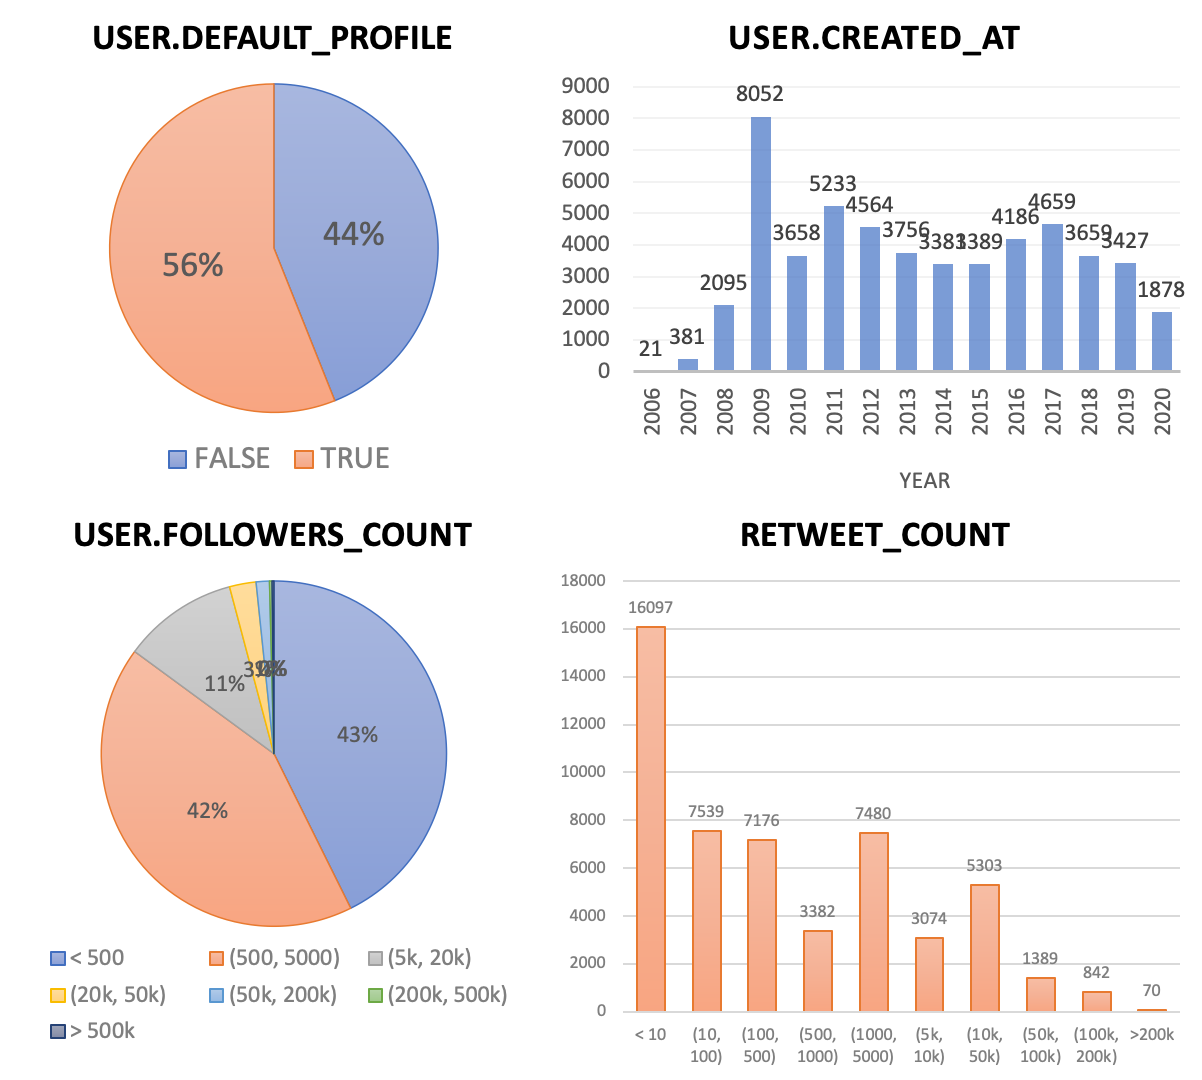
Data Exploration
We selected/created the following variables from the Twitter object that might be helpful
for
analysis:
Variable
Name
Meaning
text
The
tweet text
retweet_count
Number
of times this Tweet has been retweeted
favorite_count
Indicates
approximately how many times this Tweet has
been liked
by Twitter users.
user.screen_name
The
screen name, handle, or alias that this user identifies themselves
with.
user.description
The
user-defined UTF-8 string describing their account.
user.followers_count
The
number of followers this account currently has.
user.created_at
The
year that the user account was created on twitter
user.statuses_count
The
number of Tweets (including retweets) issued by the user.
user.default_profile
When
true, indicates that the user has not altered the theme
or background of their user profile.
date
The
date that the tweet is issued
Here are some of the variables visualized in histograms or pie charts:
Data Analysis with the Model
Recall that the predicted sentiment is represented by three integer scores: 0 for negative,
1 for neutral, and 2 for positive. Using our model to predict a sentiment score for each of
the tweet texts in our COVID-19 dataset, we can do various analyses and interpretations.
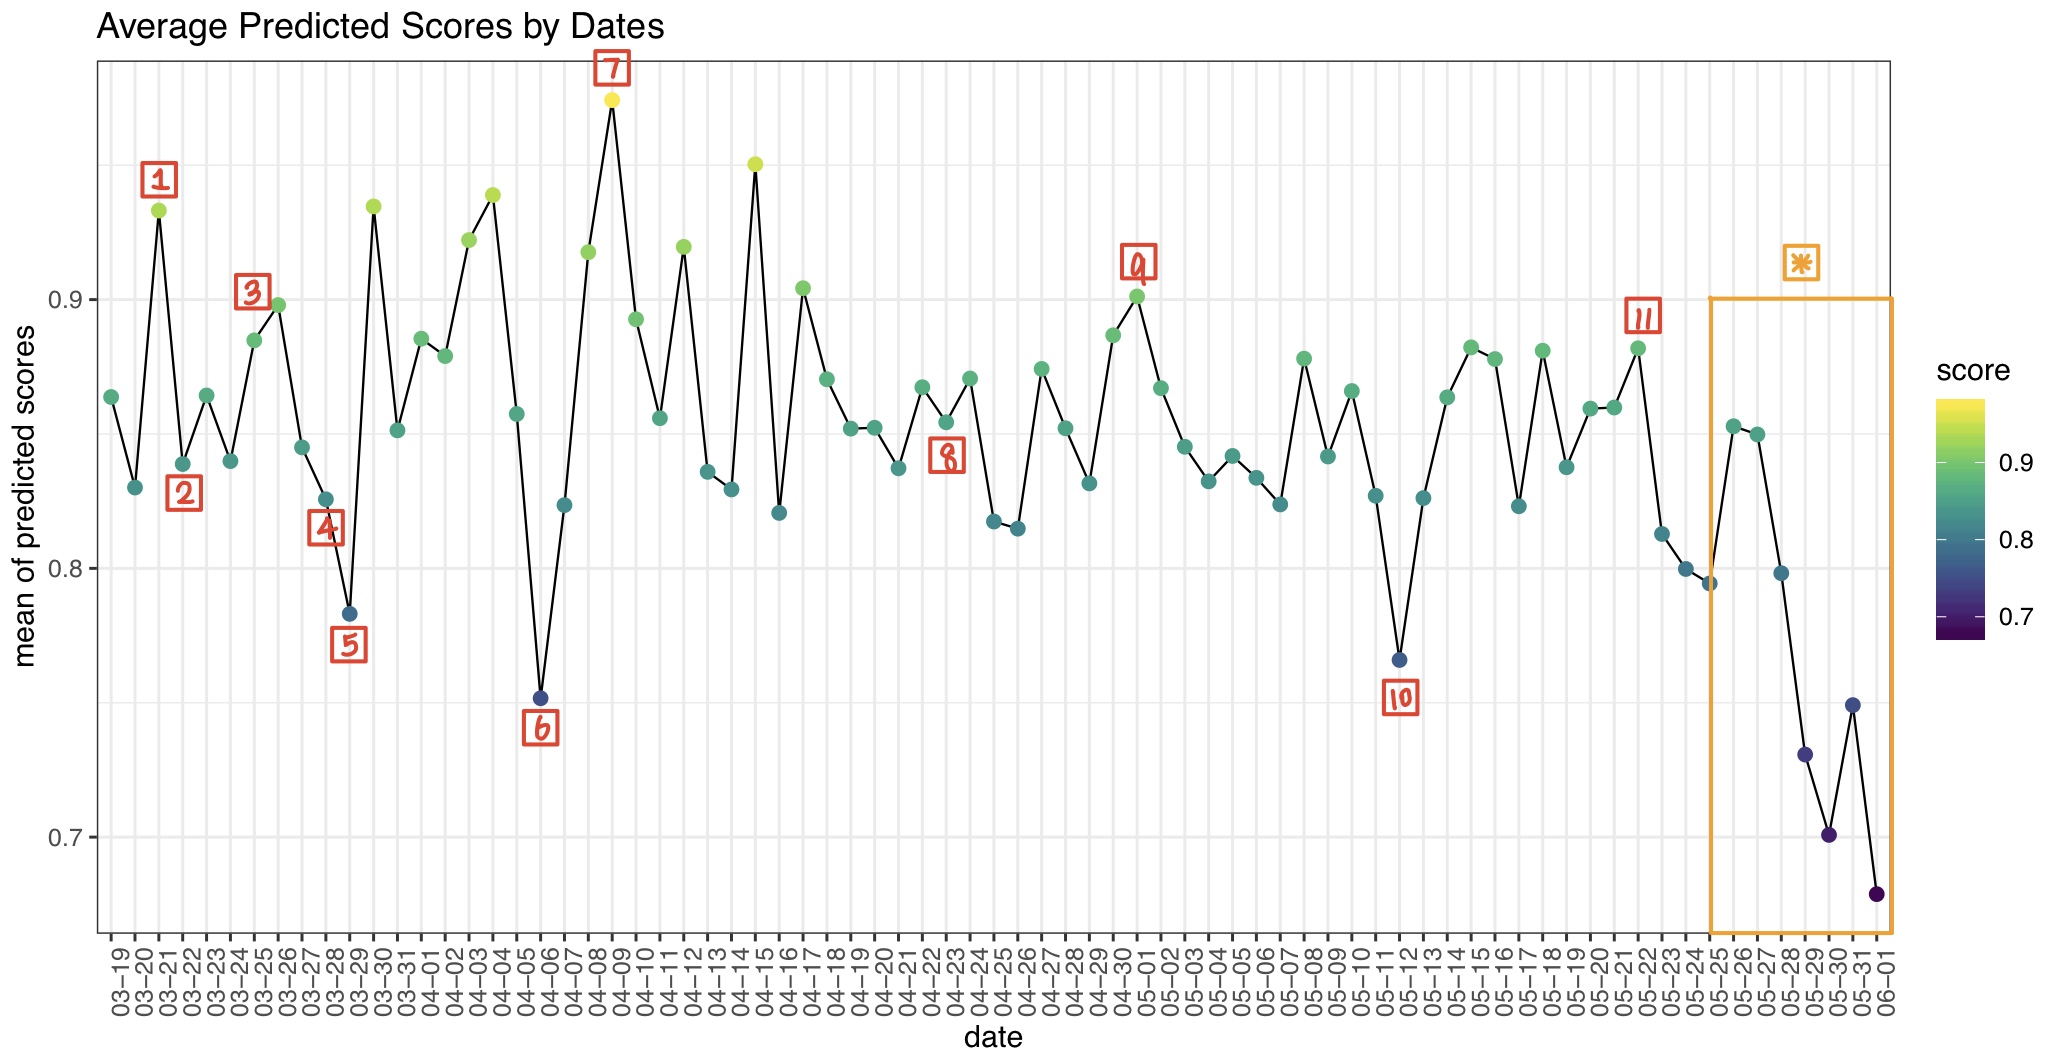
Analysis 1: Sentiment Scores against Dates
[1] (March 21) China reported no new domestic cases in Wuhan
for a third consecutive day. [2] (March 22) President Trump announced that he would
activate the federal National Guard to assist Washington, California and New York, three
of the states hit hardest by the pandemic. [3] (March 26) The Senate passed a massive $2 trillion
stimulus package designed to ease the economic blow from the coronavirus pandemic. [4] (March 28) The Centers for Disease Control and Prevention
issued a travel advisory for New York, New Jersey and Connecticut, asking residents to
refrain from non-essential travel for 14 days. [5] (March 29) The global death toll from the coronavirus
surpassed 30,000 deaths, according to Johns Hopkins University. AND President Trump
extended his administration's guidelines on social distancing until April 30. [6] (April 6) The coronavirus death toll in the U.S. surged
past 10,000. [7] (April 9) Second coronavirus vaccine trial began in the
U.S. AND California saw its first daily decrease in intensive care hospitalizations
during the coronavirus outbreak, in addition to declines in the rate of all virus
hospitalizations. [8] (April 23) President Donald Trump suggested exploring
disinfectants as a possible treatment for COVID-19 infections — an extremely dangerous
proposition that could kill people, medical experts warn. [9] (May 1) The Food and Drug Administration granted
emergency use authorization for remdesivir, the drug that has shown promise in early
clinical trials to help people with severe COVID-19. [10] (May 12) Dr. Anthony Fauci and other top Trump
administration officials testified at a public Senate hearing about the coronavirus
response and plans for people to return to work and school. Testifying by
videoconference, Fauci warned of serious consequences if governors reopen state
economies prematurely. [11] (May 22) An experimental coronavirus vaccine under
development at the University of Oxford progressed to advanced stages of human
trials. [*] (May 25 - June 1) Outbreak of George Floyd
and Black Lives
Matter protests.
Above is a graph we built that shows changes in the daily average sentiment score from March
19 to June 1. On some of the interesting peaks and valleys,
we found headlines of the corresponding dates.
During the 74 days, the average score is consistently fluctuating between 0.65 and 1 (a
higher score means overall a more positive attitude in tweets).
On March 21, China reported no new domestic cases in Wuhan for a third consecutive day, and
we can see a relatively positive sentiment of Twitter users in the U.S.
The next day, the graph shows a fall of the score, while President Trump announced he would
activate the federal National Guard to assist Washington,
California and New York.
On April 6, the coronavirus death toll in the U.S. surged past 10,000, and there is a sharp
decrease in the scores.
For another notable instance, there is a significant declining trend of feelings in people's
expression after May 25, which matches the period of nation-wide George Floyd protest
eruptions.
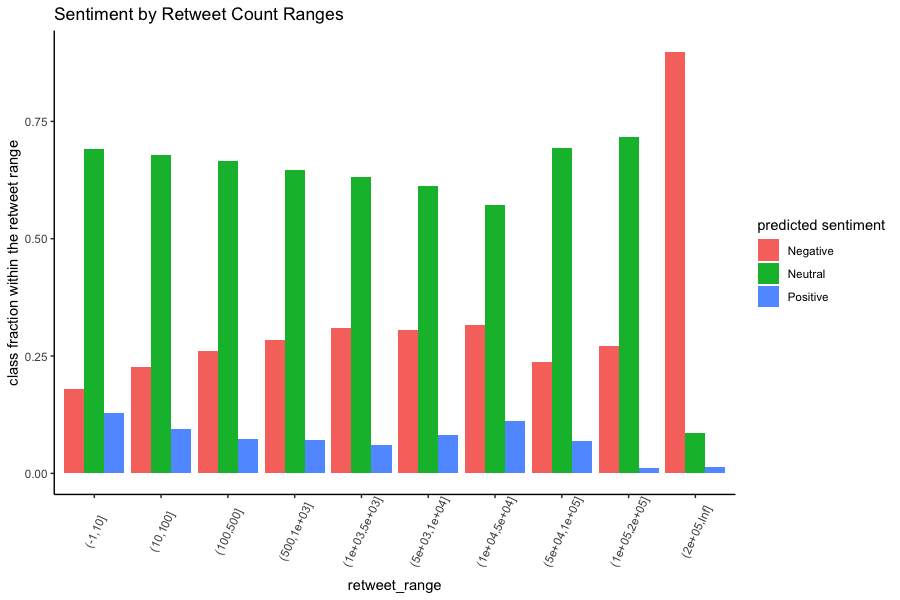
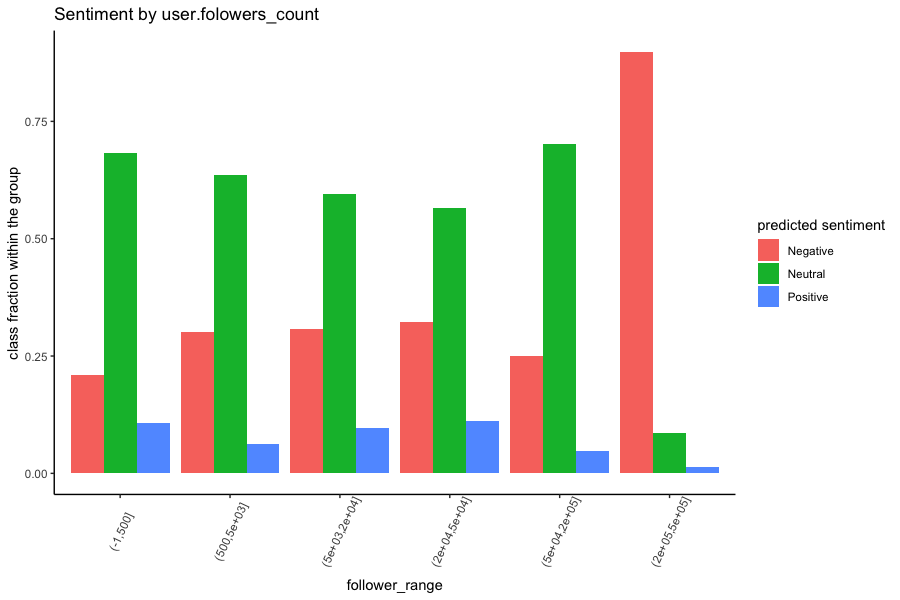
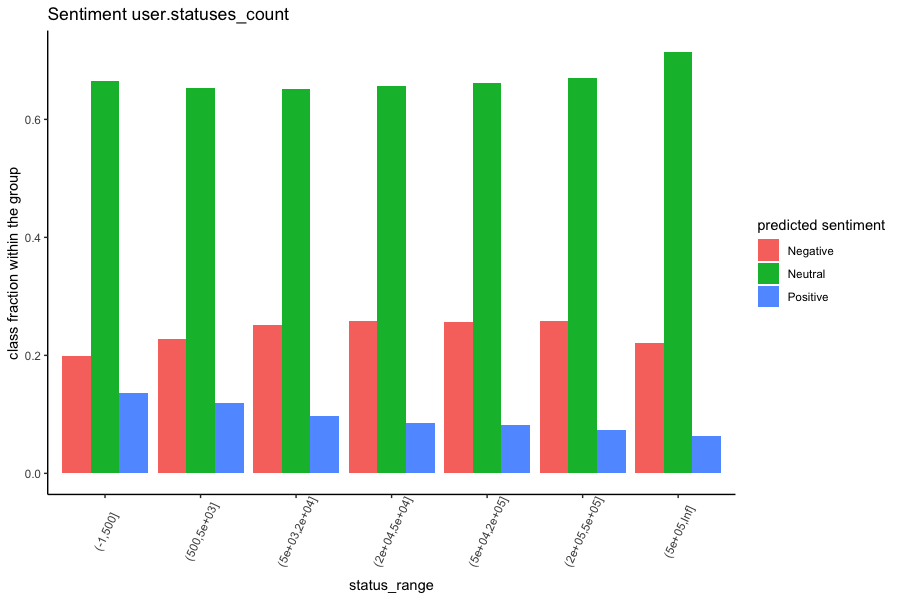
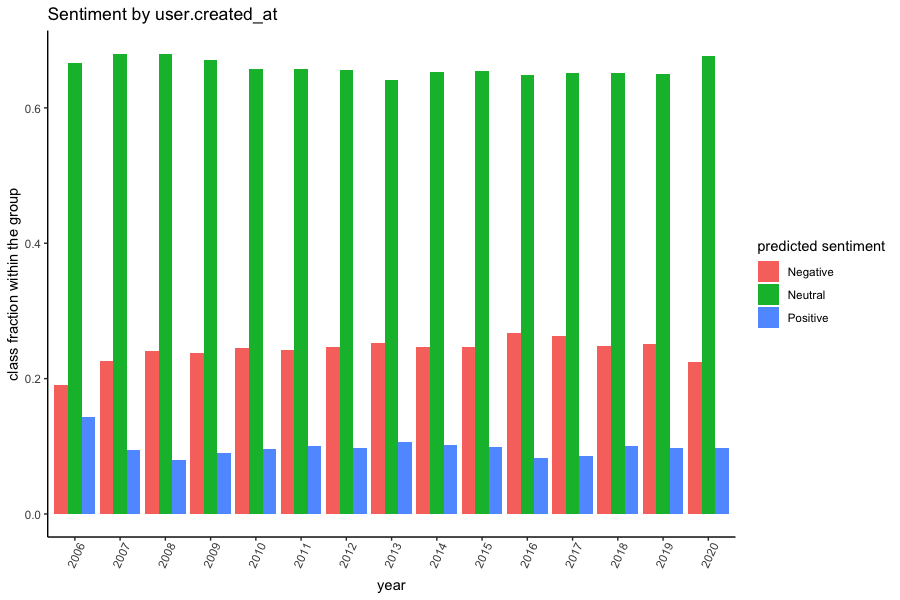
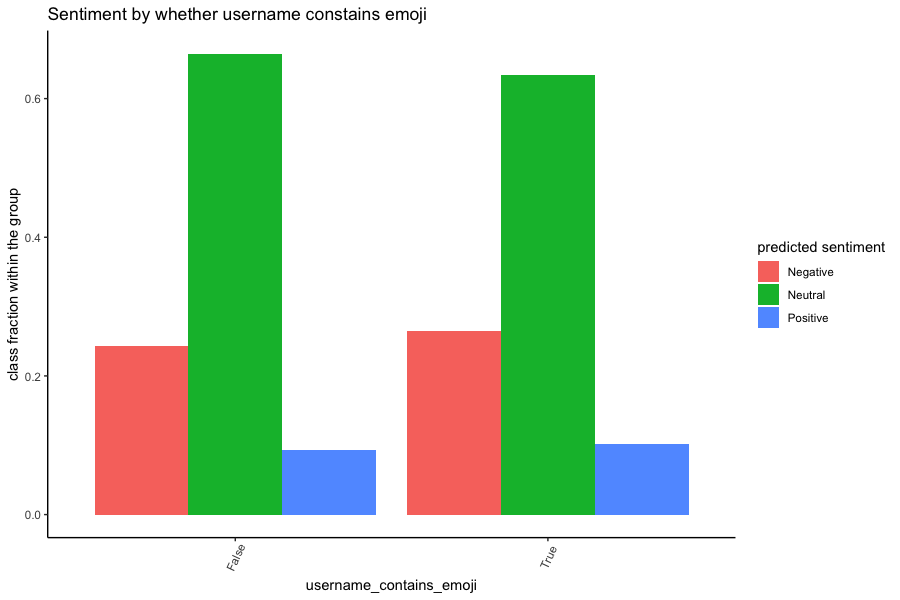
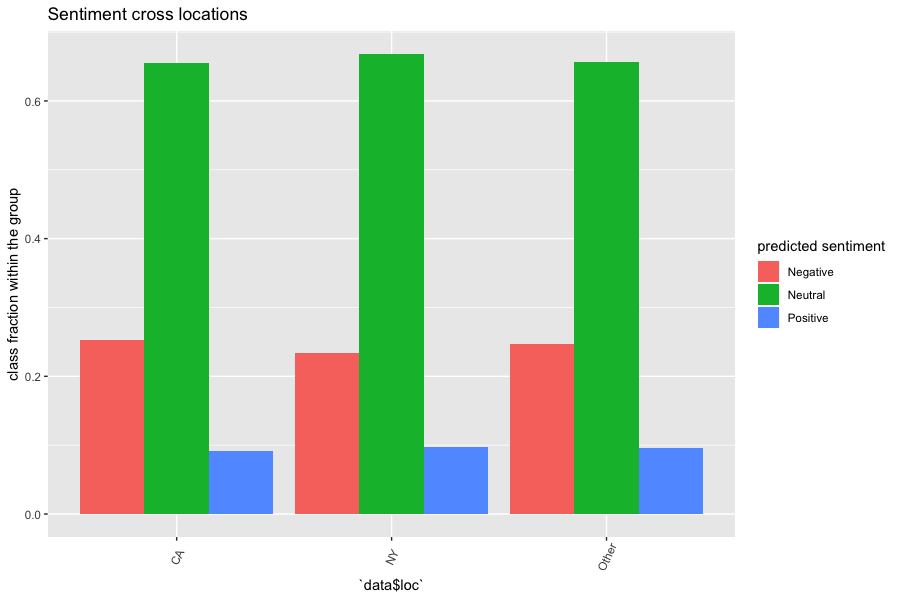
Analysis 2: Cross-Group Comparisons
We plotted the sentiment scores against different groups in our dataset, e.g., different
ranges of retweet counts, or whether the user of the tweet has emoji in their username.
There are several discoveries we found from the figures. Firstly, the
positive expression is infrequent among the COVID-19 related tweets compared to the other
two sentiments. Secondly, more than 80 percent of the popular tweets (which have >20k
retweet counts) have negative sentiment; tweets that were published by most-followed Twitter
users (who have 20k-50k followers) also have more than 80% of the negative sentiment. This
indicates that celebrities tend to favour the bad news in this pandemic; in the meantime,
the bad news is more likely to draw people’s attention. Furthermore, accounts that were
created the earliest (2006) or had issued the least tweets (<5000) are inclined to express
more positively than other users.
However, in contrast to our hypothesis, whether a username contains emoji or the
users' locations (New York vs California vs Other) does not appear to influence the sentiment scores.
Discussions
- By supplying our model with tweet text coded by ourselves, the model generally
produces
reasonable sentiment prediction results. That being said, there is still room for
improvement.
In particular, the model is not robust when it encounters very short text input.
More deep
learning tricks can be used to boost the performance, such as slanted triangular
learning rates.
- Due to the query limits of Twitter API, we could only access a relatively small
amount of COVID-19 related tweets in our study. By choosing a subsample of tweets
from each date, we hoped to get samples that represent the population well. However,
samples are ultimately not the population. Accessing the model on a larger sample
can help us acquire a more accurate estimation of people's daily emotions.
- In light of COVID-19, there are countless new stories happening each day, with
generally more negative than positive news reported. In fact, a hodgepodge of
positive and negative events can all together affect people’s expression. Therefore,
instead of matching the trends of sentiment scores with breaking news, future studies
may extract the news that people are actually discussing.
References
[1] Duong, Viet & Pham, Phu & Yang, Tongyu & Wang, Yu & Luo, Jiebo. (2020). The Ivory Tower
Lost: How College Students Respond Differently than the General Public to the COVID-19
Pandemic.
[2] Liu, Yinhan & Ott, Myle & Goyal, Naman & Du, Jingfei & Joshi, Mandar & Chen, Danqi &
Levy,
Omer & Lewis, Mike & Zettlemoyer, Luke & Stoyanov, Veselin. (2019). RoBERTa: A Robustly
Optimized BERT Pretraining Approach.
[3] Devlin, Jacob & Chang, Ming-Wei & Lee, Kenton & Toutanova, Kristina. (2018). BERT:
Pre-training of Deep Bidirectional Transformers for Language Understanding.